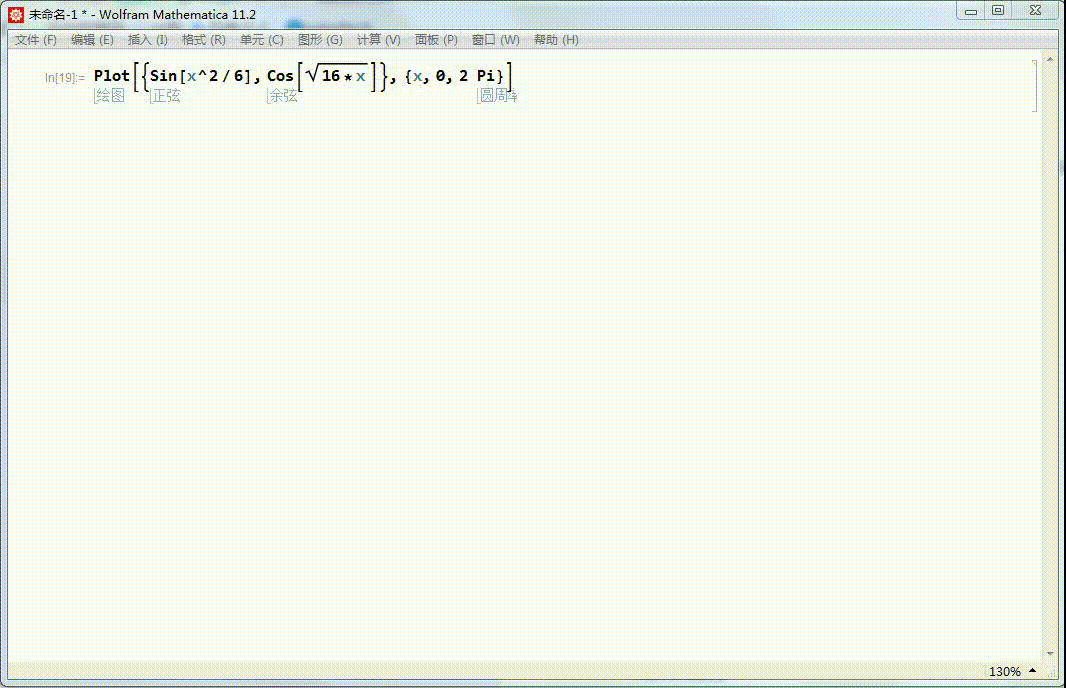
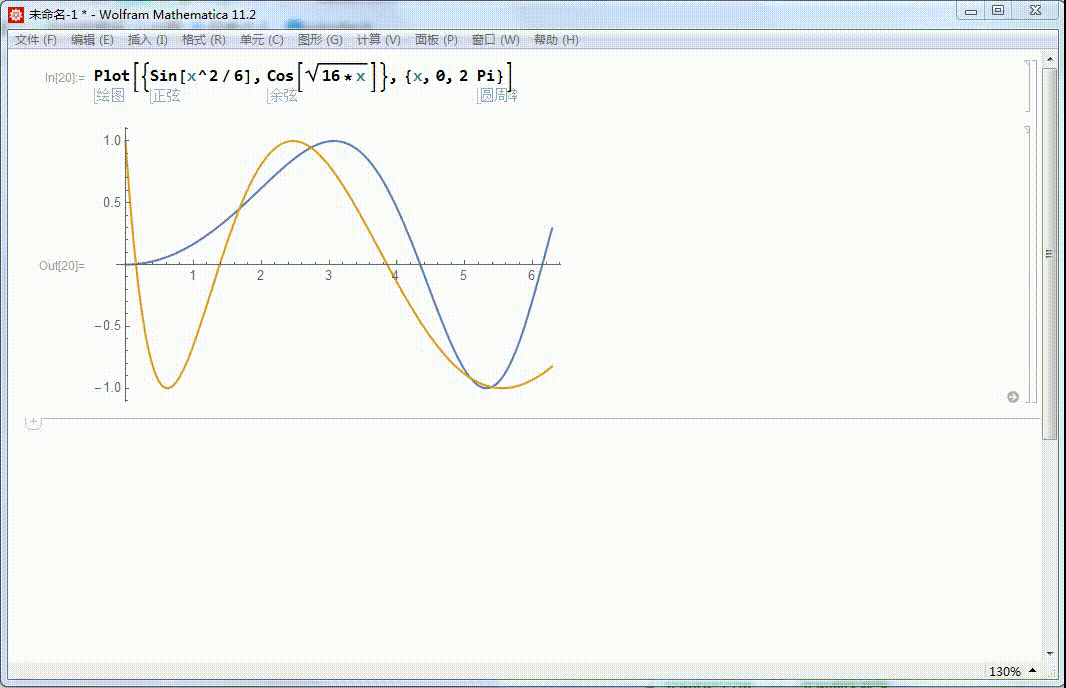
【Mathematica入门】Plot函数图像的图例

 时间:2024-10-11 22:49:15

1、先来绘制两条曲线:Plot[{Sin[x^2/6], Cos[Sqrt[16*x]]}, {x, 0, 2 Pi}]

【Mathematica入门】Plot函数图像的图例

2、添加图例,需要使用选项:PlotLegends 。如果想用函数的解析式作为图例,可以指定为:PlotLegends -> "Expressions"图例默认加载图像的右边。

【Mathematica入门】Plot函数图像的图例

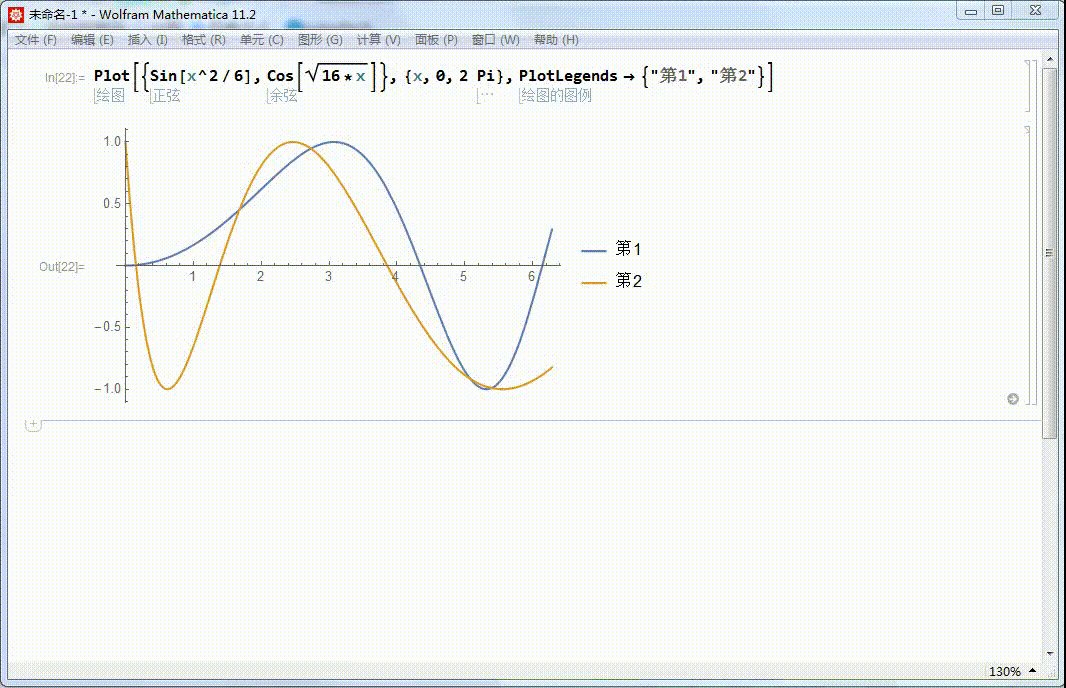
3、如果想要使用别的字符作为图例,需要专门指定:PlotLegends -> {"第1", "第2"}

【Mathematica入门】Plot函数图像的图例

4、如果想把图例放到图像上面,需要使用Placed指定:PlotLegends -> Placed[{"第1", "第2"}, Above]

【Mathematica入门】Plot函数图像的图例

5、如果想把图例放在图内某个具体的位置,需要指定其坐标:PlotLegends -> Placed[{"第1", "第2"}, {0.36, 0.25}]

【Mathematica入门】Plot函数图像的图例
  • 干货Mathematica,加图例,坐标轴文字,实虚线
  • matlab中字母下标怎么打
  • 如何还原matlab默认窗口布局
  • 如何在matlab画的图中改变坐标显示的范围
  • Matlab坐标轴间隔怎么设定
  • 热门搜索
    保护树木的手抄报 关于孝道的手抄报 道路交通安全手抄报 交通安全的手抄报 万圣节英语手抄报 小学生诚信手抄报 关于礼仪的手抄报 手抄报标题设计 放飞科技梦想手抄报 五一劳动节手抄报古诗