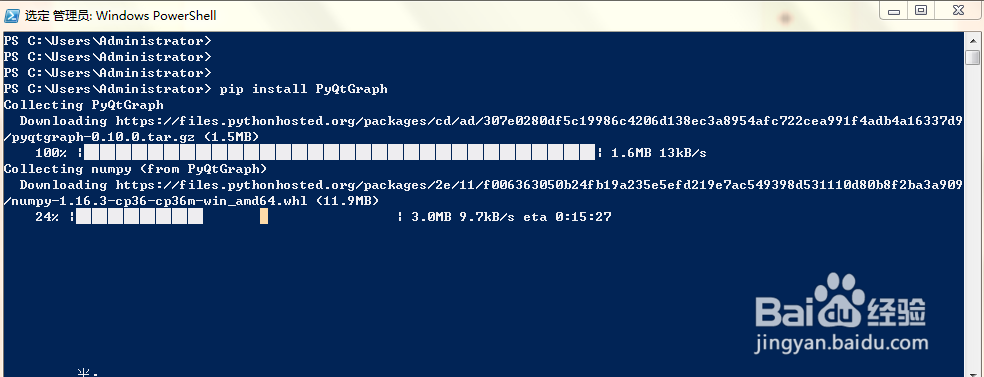
1、安装PyQtGraph:打开终端,使用命令pip install PyQtGraph
2、安装PySide: 在终端使用命令pip install PySide安装
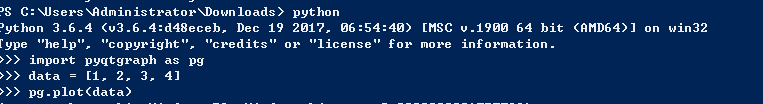
3、PyQtGraph使得从命令行可视化数据变得非常容易。注意:
import pyqtgraph as pg
pg.plot(data) # data can be a list of values or a numpy array
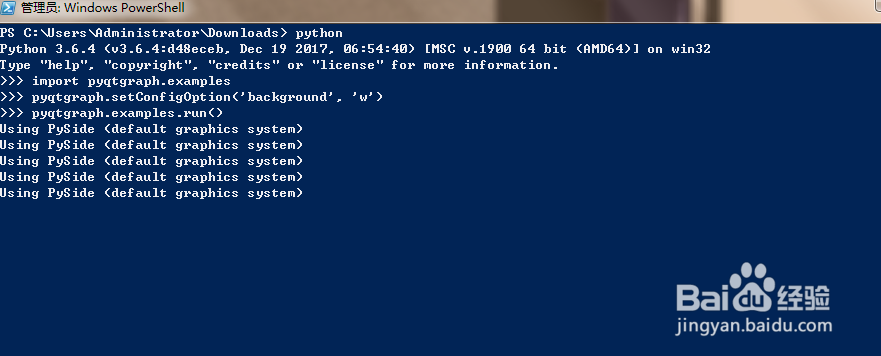
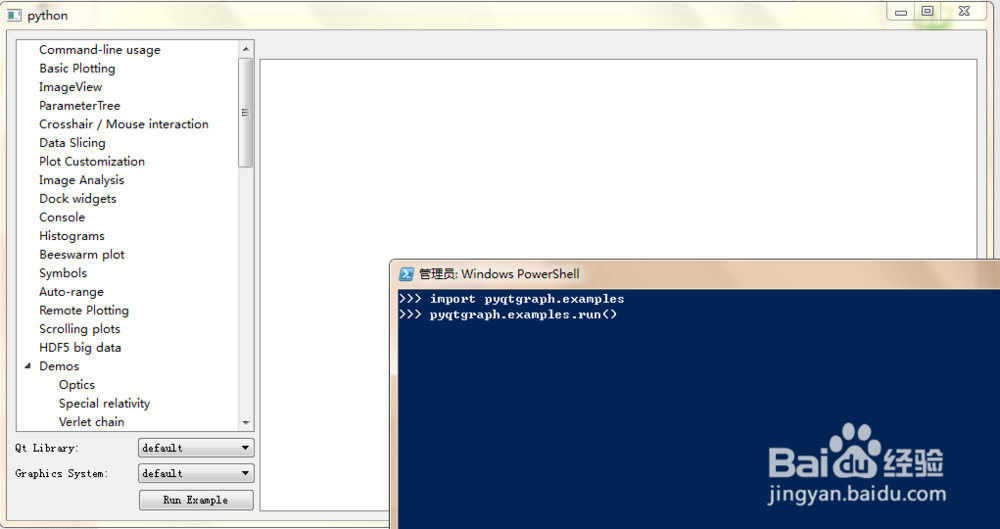
4、运行官方小示例:
import pyqtgraph.examples
pyqtgraph.examples.run()
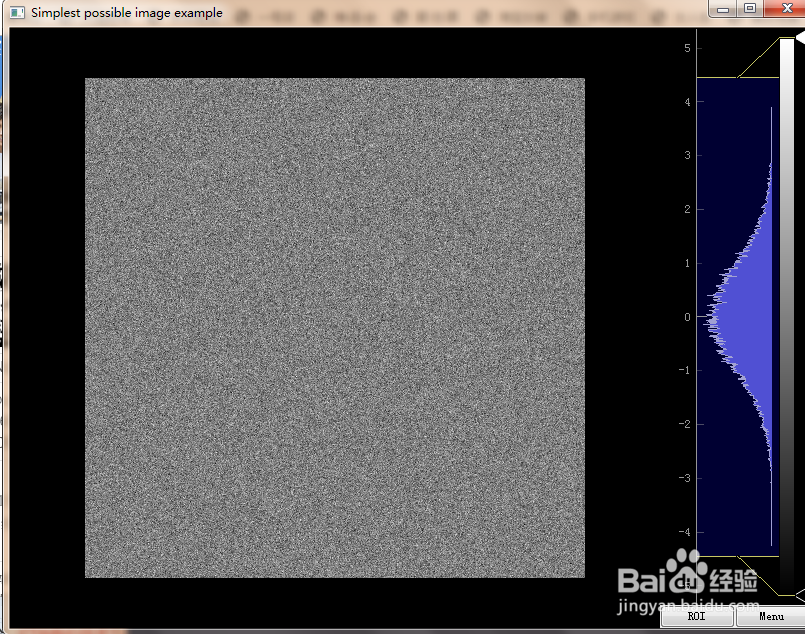
运行后会弹出如图窗口
5、在窗口的Qt Library选项,选择PySide,在Graphics System选项,选择native
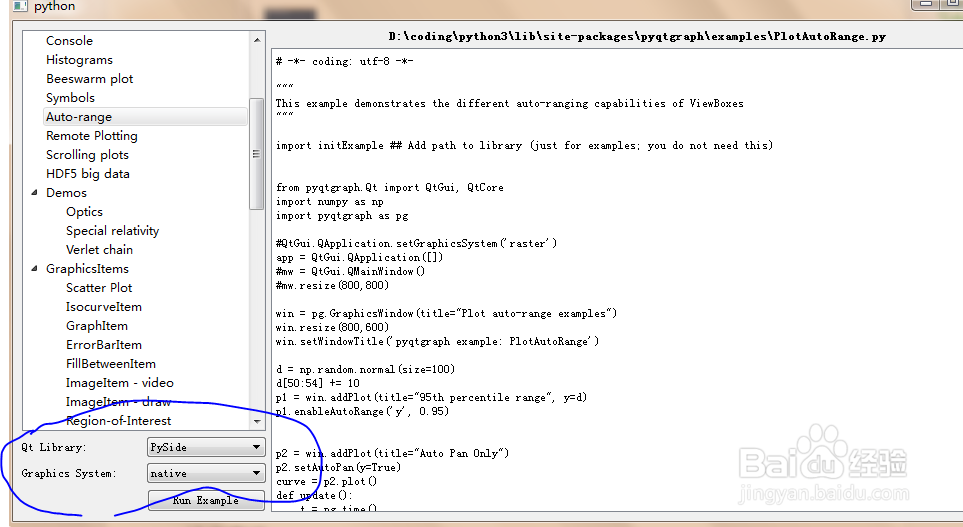
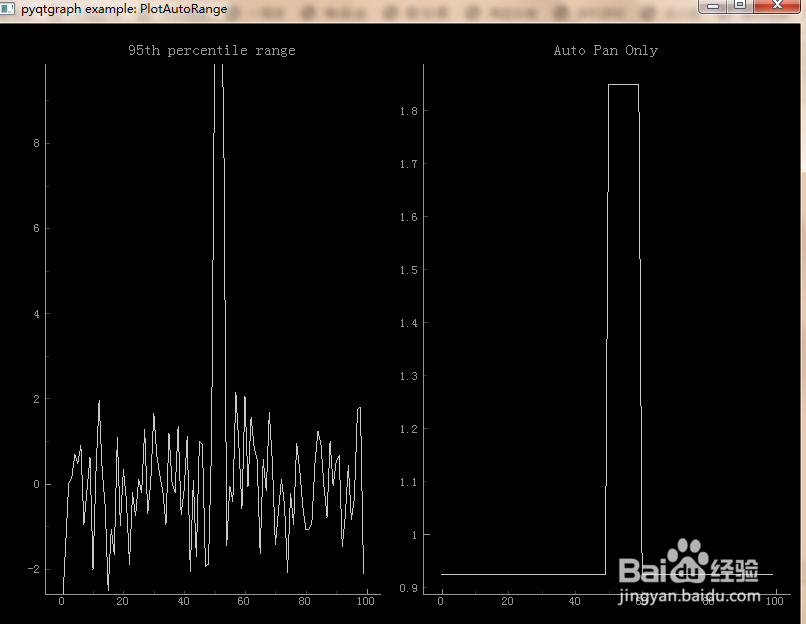
6、点击run example按钮,弹出示例窗口运行
7、使用代码:
pg.setConfigOption('background', 'w')
pg.setConfigOption('foreground', 'k')
修改示例背景